How to detect water leaks caused by technical failures or negligence
Immediately after login, the application Smart Water-Meters draws a colourful table with current water consumption on a particular day. Each field of the table is tinged with colours varying from green to red as to the consumption amount (related to the given line). Red fields indicate high consumption.
For example, in the table below we can see that water consumption in the whole BONEGA establishment rose between 11 and 12 o´clock (red field 840,5 1). Furthermore, as resulting from the table, this rise was in large part caused by the consumption in Building 19 (red field 309 1).
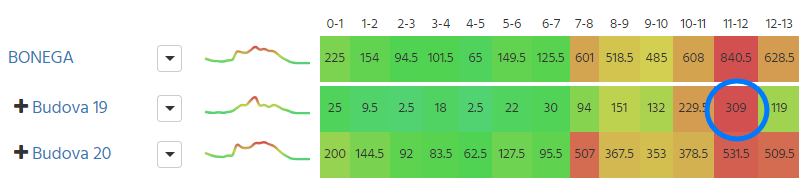
When clicking on the plus button for Building 19, it is possible to expand the list of flats in this building. As in the previous step, it is possible to find out that the consumption significantly rose mainly in Flat 2.
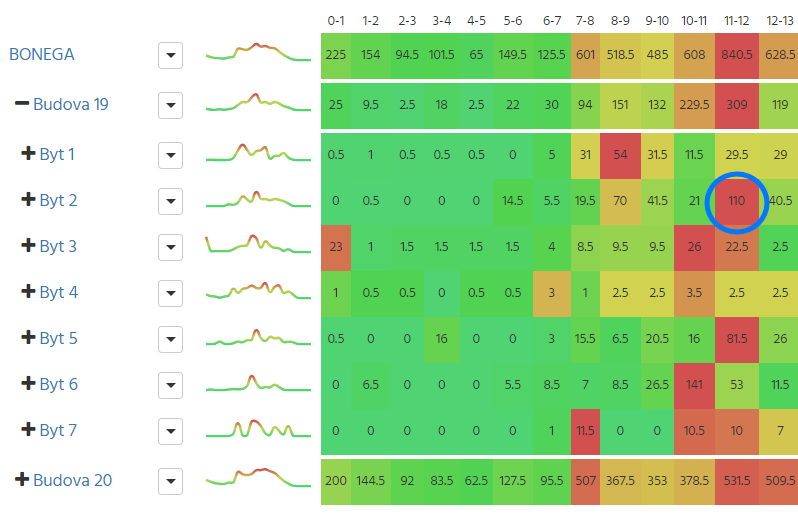
The flats can be expanded to monitor individual transmitters (see picture below). This allows us to find out that the large rise in water consumption in the whole BONEGA establishment was caused by high consumption in the bathroom in Flat 2. Then we can check just this particular flat. The follow-up green field (17 l) shows that the forgotten running shower could be turned off and the consumption returned to normal.
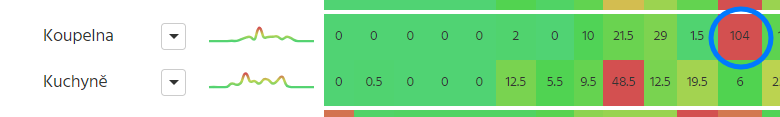
In this way, water leaks and forgotten running “taps” can be localized very quickly and the situation can be resolved immediately.